Online Chart Maker for Business Reports

Online Chart Maker for Business Reports Make powerful business charts in minutes.   Livegap Charts  helps you create clear, customizable charts for business reports, presentations, and analytics. No design experience required—just import your data and go! Start Creating Your Business Chart Now Why Choose Livegap Charts for Business? Import Data Easily: Upload from Excel, Google Sheets, or CSV. Ready for Presentations: Export charts as PNG, SVG, or Video. Professional Look: Choose from business themes and Read more…
Icon Matrix

Icon Matrix Web App

Need To Create Pictographs “pictograms are charts in which icons represent numbers to make it more interesting and easier to understand. A key is often included to indicate what each icon represents. All icons must be of the same size, but a fraction of an icon can be used to show the respective fraction of that amount” from Wikipedia Try Livegap Icon Matrix : free online tool that enables anyone to create icon array ( Read more…

Bar chart

Hand-Drawn Charts

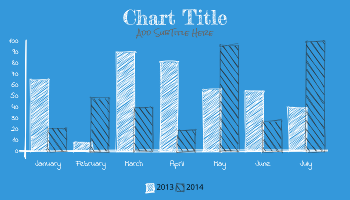
Everybody loves freehand drawing.  A sketchy, hand-drawn-like chart in a report  look beautiful. Now you can simulate hand-drawings  chart in livegap  To look like it was drawing by hand. Only actived the FreeHand  option tab and you chart will be sketchy.       Here same example created with it:       Usage: Stroke Roughness : Numerical value indicating how rough the Stroke is.  0 would be a perfect Line. Default value is 1. Read more…

Livegap Charts
How to make text multi line ?

Sometimes in your Charts  you need to make Text  in more than one line ,this is what the \n element is used . To  make the title for the chart in 2 line,change the title from  Chart Title   to Chart \nTitle you can also  make the chart labels or legend multi line. ex:  16\nDecember\n2016 . it will render on three line. like this: 16 December 2016