Online Chart Maker for Business Reports
Make powerful business charts in minutes.
Livegap Charts helps you create clear, customizable charts for business reports, presentations, and analytics. No design experience required—just import your data and go!
Start Creating Your Business Chart Now
Why Choose Livegap Charts for Business?
- Import Data Easily: Upload from Excel, Google Sheets, or CSV.
- Ready for Presentations: Export charts as PNG, SVG, or Video.
- Professional Look: Choose from business themes and color palettes.
- No Sign Up Needed: Start instantly, no registration required.
- Secure & Private: Your data stays private.
How It Works
- Select Your Chart Type (Bar, Line, Pie, etc.)
- Import Your Business Data (Excel/CSV/Google Sheets)
- Customize Titles & Colors to match your branding
- Download or Share your business chart
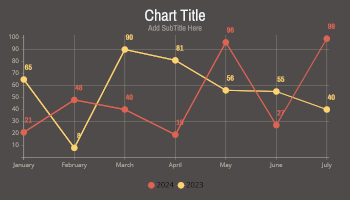
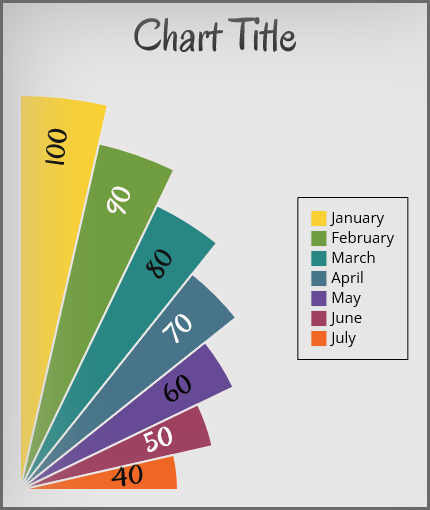
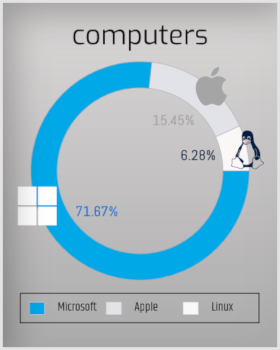
Sample Business Charts
Professionals Worldwide
“Livegap Charts helped our team create boardroom-ready charts in minutes.”
— Sarah L., Marketing Manager
“Our reports look so much better with Livegap!”
— Tom B., Financial Analyst
FAQ
Can I use Livegap Charts for confidential business data?
Yes! Your data is processed in your browser and never stored.
Can I create dashboard charts for my team?
Absolutely! You can share or export charts for use in any business dashboard or report.
0 Comments