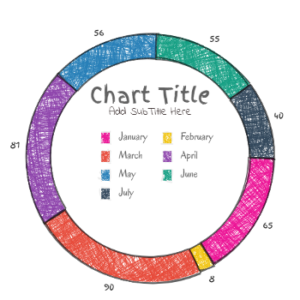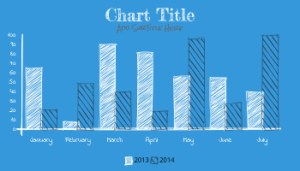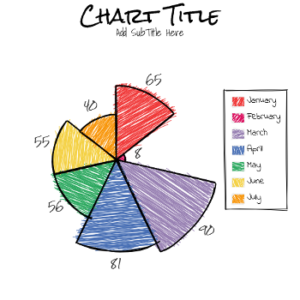
Everybody loves freehand drawing. A sketchy, hand-drawn-like chart in a report look beautiful.
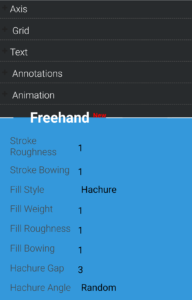
Now you can simulate hand-drawings chart in livegap To look like it was drawing by hand. Only actived the FreeHand option tab and you chart will be sketchy.
Here same example created with it:


Usage:
Stroke Roughness : Numerical value indicating how rough the Stroke is. 0 would be a perfect Line. Default value is 1. There is no upper limit to this value, but a value over 10 is mostly useless.
Stroke Bowing : Numerical value indicating how curvy the lines are when drawing a sketch. A value of 0 will cause straight lines. Default value is 1.
Fill Style : Select one of this styles To use as The Fill Style
- Hachure : draws sketchy parallel lines with the same roughness as defined by the Fill Roughness and the Fill Bowing properties .you can configured it using the Fill Weight , Hachure Angle, and Hachure Gap properties.
- Solid : fill the shape with color.
- zigzag : draws zig-zag lines
- cross-hatch: Similar to Hachure, but draws cross hatch lines
- Alpha: use the Alpha of the color if the alpha of the color 0 no fill at all, if the alpha of the color is 1 the color will use solid fill , betwen 0 -1 will use Hachure fill and Hachure Gap will increase with the alpha value.
Fill Weight : Numeric value representing the width of the hachure lines
Fill Roughness : Numerical value indicating how rough the lines in Fill is. 0 would be a perfect Line. Default value is 1. There is no upper limit to this value, but a value over 10 is mostly useless.
Fill Bowing : Numerical value indicating how curvy the lines in the Fill . A value of 0 will cause straight lines. Default value is 1.
Hachure Gap : Numerical value that defines the average gap, in pixels, between two hachure lines.
Hachure Angle : defines the angle of the hachure lines.
- Numerical value
- Vertical
- Horizontal
- Random
- Alpha: using Alpha of color to define the direction of the Hachure lines.

0 Comments